Athena Engineering S.r.l.
News

How to Read a Pump Type Spectrum Diagram: A Step-by-Step Guide

Ⅰ.How to Read This Pump Type Spectrum Diagram

1. Axes Interpretation


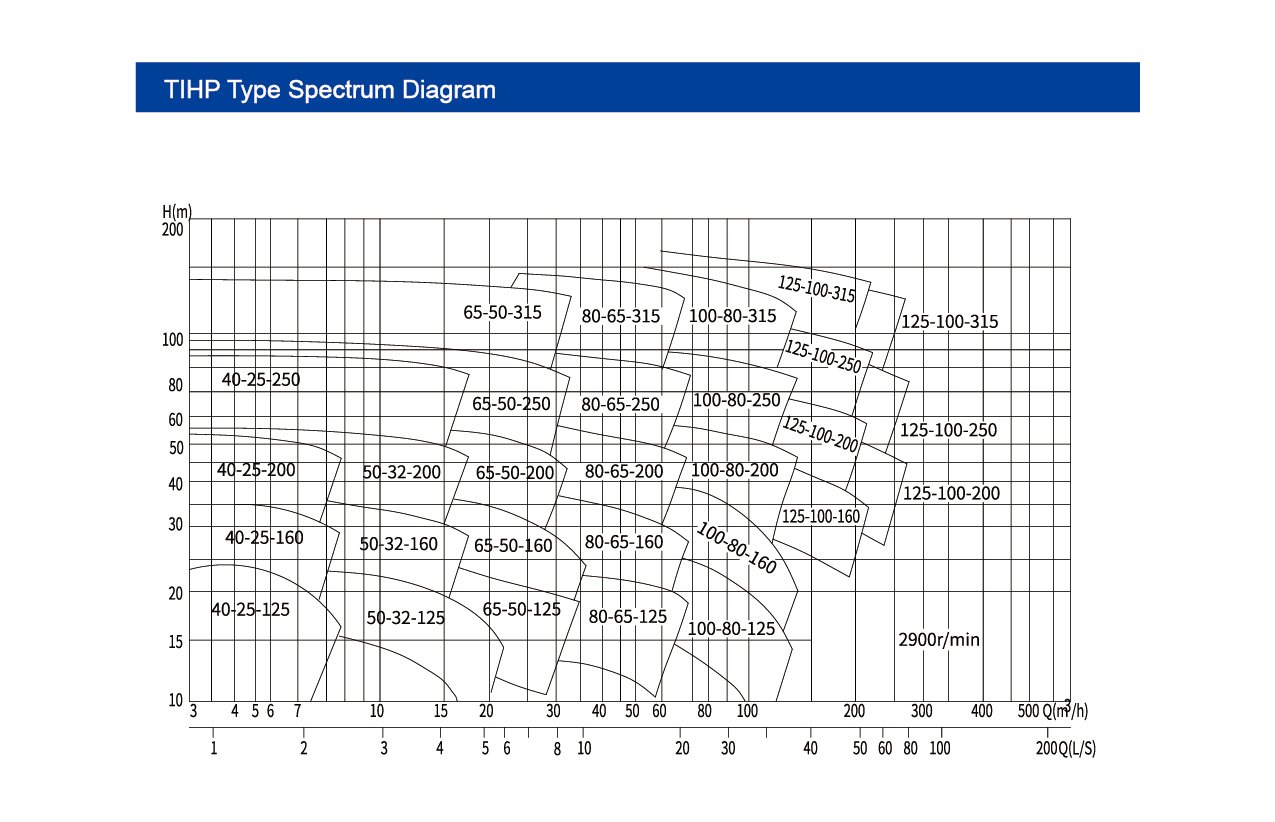
  • Horizontal Axis (X-axis): Represents flow rate (Q) in cubic meters per hour (m³/h), increasing from left to right.
  • Vertical Axis (Y-axis): Represents head (H) in meters (m), increasing from bottom to top.


Ⅱ. Curves and Zones

The diagram includes multiple curves and zones, each representing a specific pump model. For example, "40-25-125" and "50-32-160" denote different pump models.


  • Points within curves: Each point on a curve indicates the head value of the model at a specific flow rate. For instance, within the "40-25-125" zone, a series of points show the head at various flow rates for this model.


Ⅲ. Key Steps: Working Point and Selection    


  1. Determine required parameters: Clarify the design flow rate (Q₀) and design head (H₀). For example, a factory needs a pump to transport 100 m³/h at 80 m head.
  2. Locate the working point: Find Q₀ on the X-axis and H₀ on the Y-axis; their intersection is the working point. If the point falls within a model’s polygonal zone, that model theoretically meets the requirement.
  3. Example: For Q=80 m³/h and H=80 m, check if the point lies within zones like "100-80-250" to assess suitability.


Prioritize the high-efficiency zone: If a zone has denser curves or shading (marked in some diagrams), it indicates the high-efficiency range (efficiency ≥80%). Select models whose working points fall within this zone for optimal energy savings.

Ⅳ. Rotational Speed and Additional Info

The notation "2900 r/min" at the bottom-right corner denotes the rated speed of the pumps in this spectrum (standard speed for motor-driven pumps). For different speeds (e.g., 1450 r/min), use the similarity law to convert performance:


  • Flow rate is proportional to speed.
  • Head is proportional to the square of speed.


Ⅴ. Quick Selection Logic


  1. Identify Q and H requirements, then find the corresponding model zone.
  2. Prioritize models with working points near the zone center (high-efficiency area).
  3. Note the model’s inlet/outlet diameters (e.g., 40, 50 mm) to ensure compatibility with site pipelines.


Ⅵ. About Teffiko Pumps

In summary, Teffiko’s 5th-generation TIHP pump type spectrum diagram clarifies applicable working conditions and high-efficiency zones through flow-head coordinates, model zones, and performance curves. You can quickly select models by matching parameters to zones. For questions about curve interpretation, working condition adaptation, or customized solutions, Teffiko’s professional technical team provides precise selection guidance, performance simulation, and installation support. Visit www.teffiko.com or email sales@teffiko.com to optimize industrial fluid transportation.


Related News
X
We use cookies to offer you a better browsing experience, analyze site traffic and personalize content. By using this site, you agree to our use of cookies. Privacy Policy
Reject Accept